Product Life Cycles
The Ultimate Differentiator in Successful Corporations
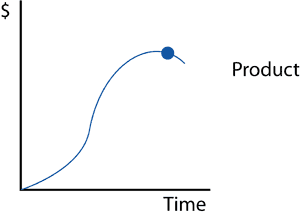
Successful corporations understand that their future depends on sales. In order to have sales, they have to properly manage their products. Therefore, they carefully monitor the sales of all products, as well as gauge where their products are on the life cycle s-curve. Companies have known for years that products produce higher sales when introduced in the marketplace and then less as they mature to the point where they level off at a number that may or may not warrant keeping them on the shelf. To better understand product sales cycles, corporations have adapted to using s-curve graphs as examples that help illustrate the patterns of a product over a set period of time. To know a product goes through these sales stages is one thing, to actually see it illustrated helps corporations understand what can happen and predict when it may occur.
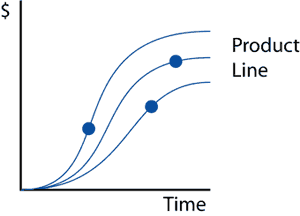
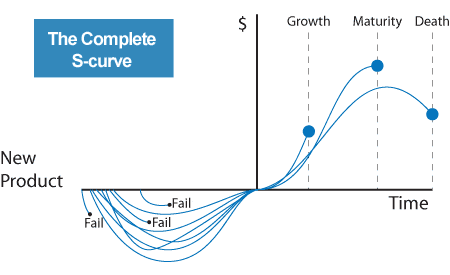
Product life cycle s-curves map out a companies future. Although there are peaks and valleys in every product's life cycle, generally a product goes through a rise, a plateau, and eventually a fall. Products may remain in a company's product-line for an extended period; however, their positive impact to the corporation may have already been felt or realized. Plotting these product patterns helps a corporation visualize the health of each of its products and overall product-line; however, the real story is how products get to the life cycle s-curve. This is the area that provides the constant flow of potential new products, which delivers stability and revenue to the organization.
GOOD

An innovative company has multiple products in the pipeline at different maturity levels to diversify and grow the company.
BAD

A one or two hit non-innovative company runs the risk of competitive items and market shifts destroying their line.
At Davison, we have expanded the traditional s-curve graph to show what it really looks like to be in business. Companies must meet the challenge of innovative research and development, so they have more products entering their s-curve pipeline.

If your corporation is not currently practicing this procedure, we can assist you with plotting each product and its overall performance. We recommend that you contact us to analyze one of your current products, as demonstrated in the chart above. This is where most companies fall short and we quickly tell you what you can expect from a product in the near future.
Over the course of history, corporations have quickly realized that not adapting to tracking methods like s-curve graphs exposes them to product cycles, which eventually, if left unattended, jeopardize the success of their organization.
To help fill any voids in your company's product-line, contact us.